
How the MAP Works

The MAP brings together community input, adopted City plans, project ideas, and data into one transportation investment framework. This helps LADOT and partner departments understand which mobility needs may be ready for near-term action and which may need more planning, funding, or coordination over time.
The MAP focuses on transportation investments that help people move around Los Angeles.
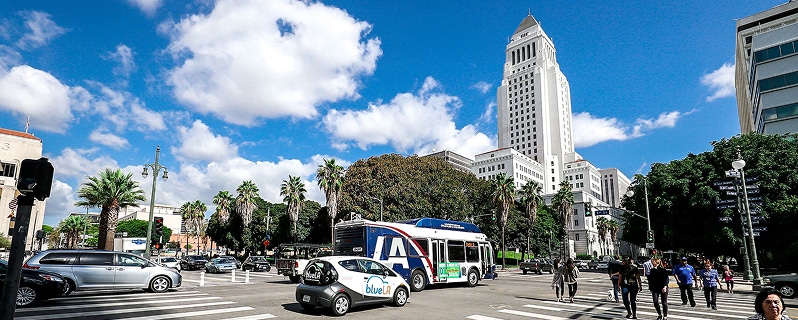
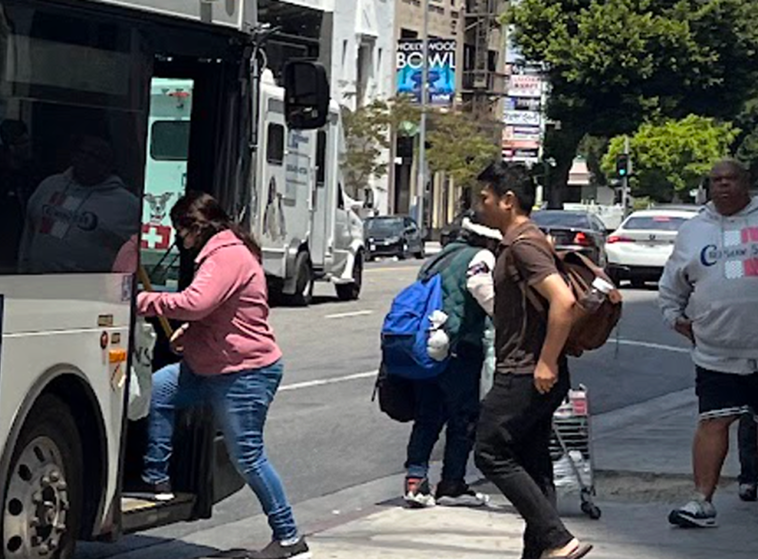
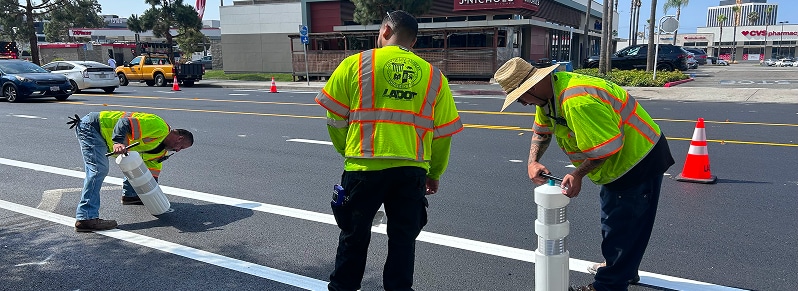
To support coordination with the Citywide CIP, the MAP organizes these investments into mobility categories, including: streets, sidewalks, transit access, traffic operations, bridges and tunnels. Below you can see a high level view of the type of investment consider for in the MAP.
Transit
- Transit Yards
- Transit Fleet Vehicles
- Bus Stops & Transit Amenities
Streets & Sidewalks
- Major Streets
- Local Streets
- Off-Street Paths
- Accessibility Investments
- Hillside Stabilization
Transportation Operations
- Traffic Safety Enforcement
- Traffic Management Systems
- Off-Street Parking
- Emerging Initiatives
Bridges
- Vehicular Bridges
- Non-Vehicular Bridges
Tunnels
- Vehicular Tunnels
- Non-Vehicular Tunnels
 The MAP starts with a citywide inventory of transportation projects, programs, and needs. These investments are reviewed using community input, adopted City goals, equity analysis, and available project data. This process helps LADOT and partner departments organize transportation needs, compare projects more consistently, and identify near-term priorities, longer-term needs, and programs that should continue to be coordinated over time.
The resulting MAP priorities help inform the Citywide Capital Improvement Program (CIP) and guide future transportation investments across Los Angeles.
Los Angeles has more transportation needs than available funding and delivery capacity. The MAP uses a prioritization process to help evaluate projects consistently across the city.
Projects are reviewed based on how they support MAP goals, including safety, connectivity, and equity. This helps identify projects that may provide strong transportation benefits and should be considered for future investment.
Health & Safety
Weight — 40%
Measures
Priority Safety Corridors: 30 pts
Mobility Benefit: 10 pts
Connectivity
Weight — 30%
Measures
Networks: 10 pts
Gap Closure: 20 pts
Equity
Weight — 30%
Measures
Networks: 25 pts
Gap Closure: 5 pts
Total Mobility Policy Score — 100 pts
 Prioritization is one tool used to guide decision-making. A project’s score does not determine delivery on its own. Future project delivery will also depend on funding, staffing, project readiness, legal requirements, coordination with other capital work, community engagement, and Citywide CIP and budget decisions.