Walk & Bike Count
LADOT launched the Walk & Bike Count in 2019. The count is performed every odd year and allows us to better understand the current trends in active travel. LADOT uses the data from our bi-annual count in a number of ways, such as:
1. Understanding changes in people using active modes of transportation;
2. Providing data to inform and support decision-making;
3. Tracking usage before and after transportation projects and programs are implemented;
4. Understanding how travel trends and behaviors vary across geographic areas and street typologies;
5. Forecasting and projecting future usage on projects being planned and designed; and
6. Identifying locations for future bicycle and pedestrian improvements
The Walk and Bike count separates three primary modes of active travel: people walking, biking, and riding motorized scooters. In addition, a fourth category, other
captures all other active travel modes.
Count locations may vary each count as we seek to study locations with recent or future mobility improvements. In 2023 we conducted counts at 100 locations throughout the city: 79 locations were temporary eight-hour counts and 21 locations were counted using our permanent 24-hour counters.
2023 Count Locations
Click each dot to see the location name and the bicycle facility type
Since 2021, the City has installed 35 permanent pedestrian and bike counters throughout the City. Often, two counters are placed at one location, one on each side of the street, when a single counter would not have a view of both sides of the street. Our counters are running 24/7. You can access this data at any time below:
View Permanent Counter Data
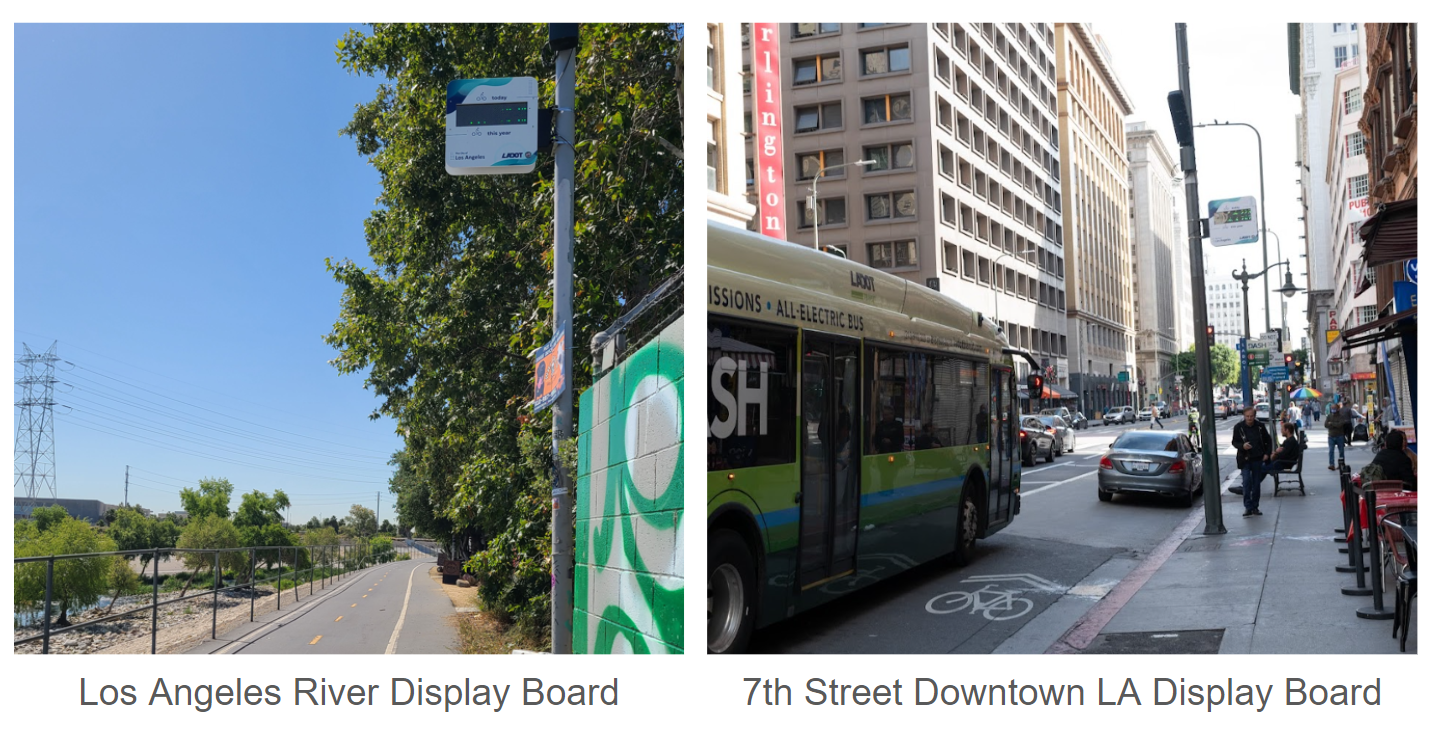
The City has also installed two counting display screens at locations with the highest bike ridership across the City.
2019 Walk & Bike Count
● View the report
● View the data
2021 Walk & Bike Count
● View the report
● View the data
2023 Walk & Bike Count
● View the report
● View the data


